Functions as Data Translators
If you have read the previous posts carefully you should now be familiar with high-dimensional data. In this last introductory article we are now going to look at what machine intelligence people mean when they think about manipulating data: they apply functions to data.
We will learn what functions are and look at different examples. Once we know what they are, we can in the next post see how to learn them - which is essentially what learning machines do.
Mathematical Functions
Mathematicians use the term function rather differently from the common sense definition. In everyday language we talk about the function of things in the sense “what is the purpose of the thing” or “how does this thing work”. A function in mathematical sense is rather different. It can be best thought of as a translation from one type of data to another type. Or in other words, you give some input (data) to the function, and get some output (data):

(This figure and the first example are taken from the highly recommended Wikipedia page on functions)
Let me give you a couple of examples of these things called functions.
Object description functions
Let’s assume a couple of primitive shapes, such as triangles, squares, etc. all of different color. We can now define a function that, given a shape, outputs the color of the function:

This visualization shows how to map input data X (the shape) to some output, the shape’s color Y. All the arrows between X and Y are the defining elements of the function.
Note that for each object in X there is only one arrow pointing away from it. This is indeed a requirement because we want a function to be a unique mapping: for each input we get exactly one output. The inverse is not required, though: the square and the triangle have the same color, so the red color in Y has two arrows pointing to it. You also notice that some colors, namely blue and purple have no arrows pointing to it. All of these things are very common in functions.
So far we have only talked about functions conceptually but we have not stated how a function can automatically compute the output from the input. Let us therefore look at a simpler example to shed some light on this.
Stock price prediction function
Let us now re-introduce our simple example from the introductory post. We want to assess the stock price of some company. For the sake of simplicity, we will only use information about the annual revenue of the company (in Euro) and try to predict the stock price (also in Euro). We can describe this relationship in a big table:
| Year | Annual Revenue in January (Euro) | Price (Euro) |
|---|---|---|
| 2010 | 40.000 | 122 |
| 2011 | 50.000 | 135 |
| 2012 | 60.000 | 148 |
| 2013 | 80.000 | 174 |
| 2014 | 100.000 | 200 |
This table can be considered a function in at least three ways: either we use the year as input, we use the annual revenue as input, or we use the stock price as input. We choose the annual revenue as the input and the stock price as the output because we believe that the annual revenue is more predictive for the stock price than the year - if the company was founded 10 years earlier, we would still expect the relationship of annual revenue and stock price to be similar (unless there was something like a global crisis, but we ignore that for now).
So the input of our function is annual revenue and the output stock price. And “computing” this function is very simple: given a number for the annual revenue, we look up the row in the table containing this number and return the corresponding stock price.
Such tabular functions are common but they have a severe drawback: we cannot extrapolate - from this table alone we do not know how to get the value for the stock price for an annual revenue of 90.000 Euros or 200.000 Euros! However, the example data I have given exhibits a regularity (surprise, surprise!), namely that the stock price values in the right column are exactly 0.00013 times the annual revenue plus 70 (check this for yourself). This gives us a much more concise way of describing this function:
You see that the function gets as input the revenue, and gives as output the stock price. To make this even clearer, we usually denote the function by the symbol f and write:
The parentheses behind the f contain the inputs of the function, sometimes called arguments.
Let us visualize this function by plotting a graph which has on one axis (the x-axis) the annual revenue and on the other (the y-axis) the stock price:
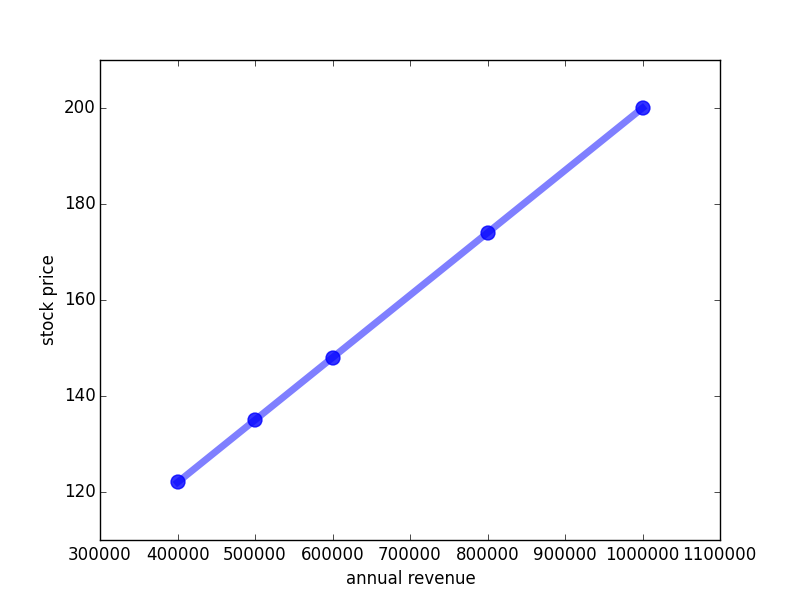
We see two interesting things here: first, we can now predict the stock price value from the annual revenue, no matter which revenue. Secondly, the relationship between revenue and stock price in our example turns out to be a line. The fact that such relationships / functions can be drawn by a line results in them being called linear functions. Linear functions are amongst the most important types of relationships in mathematics - and actually they are one of the few that mathematics can really deal with [2]. Therefore, the majority of methods in machine intelligence are based on linear functions as the one given here.
In this example, we have talked about functions that takes a single number as input, and outputs another single number. Let’s now look how functions can be applied to vectors.
Vectorial functions
In the previous post we have dealt with the question of representing high-dimensional images as vectors. Of course, we can also define functions on these vectors. Recall that a vector is merely a list of numbers of fixed size, e.g. a 3-dimensional vector looking like this:
| 0.909 | 1.000 | 0.860 |
So let’s define a linear function on 3-dimensional vectors:
What does this function do? With the little subscript we denote the individual dimensions of the input image. The function therefore computes the sum of the individual dimensions of the input vector, each dimension multiplied with some number. These numbers (here 2, 5 and -1, which I have chosen arbitrarily in this example) are called the parameters of a function. The result for this function applied to the example vector above is:
At first sight this function does not really seem to make much sense. Why should we sum up pixel values of an image? For example, it allows us draw some conclusions on whether the image is rather dark (low value of fa) or light (high value); and the different parameters of fa allow us to emphasize certain regions of the image more than others. We will see later that this is actually very useful for recognizing things in images.
You might have noticed that the previous function mapped a vectorial input to a single number. But we can also define functions that map vectors to vectors:
This function maps the 3-dimensional input vector to a 2-dimensional output vector by summing over subparts of the input (the brackets indicate that the output is a vector, and the comma separates the two output dimensions). These types of functions will be very useful as they allow us to transform data into different representations, for example lower-dimensional ones.
Image classification function
I will now introduce a last type of functions which I call decision functions or classification functions. In a nutshell, these functions look like that:
fc(Input) = 0 otherwise
Classification functions map input data to 2 (or more) categories which we simply enumerate from 0 to the number of categories (minus one).
If we put together classification functions with our knowledge about vectorial functions, we can reconsider the example in the previous post we have seen that we can draw (hyper)planes to separate two categories of objects, namely blobfish and Sebastians:
We would now assign the category Sebastian to 0 and blobfish to 1, and make the if-else-part of fc such that it takes into account whether an input sample lies on one or the other side of the line. I will not write that out explicitly, but in fact the left-of-or-right-of-line can also be cast as a multiplication of the input with a bunch of numbers. So classification functions are exactly what we want if we want to solve classification tasks - surprised?
Relationship between functions
Before closing this article, I would like to point out the relationship between the stock price and the image classification function.
For image classification, the trick for visualizing the hyperplane that separated Sebastians from blobfish was to shrink the 27x35 images to a 3x1 image which allowed us to treat images as points (vectors) in 3D space. What does this look like if we shrink the images even further, namely to a 2x1 image? We can then visualize the images as vectors in 2D. Similar as before we can now ask how to separate the shrinked Sebastians and blobfish. The answer is that we have to find a “2D hyperplane” - which turns out to be just a line!
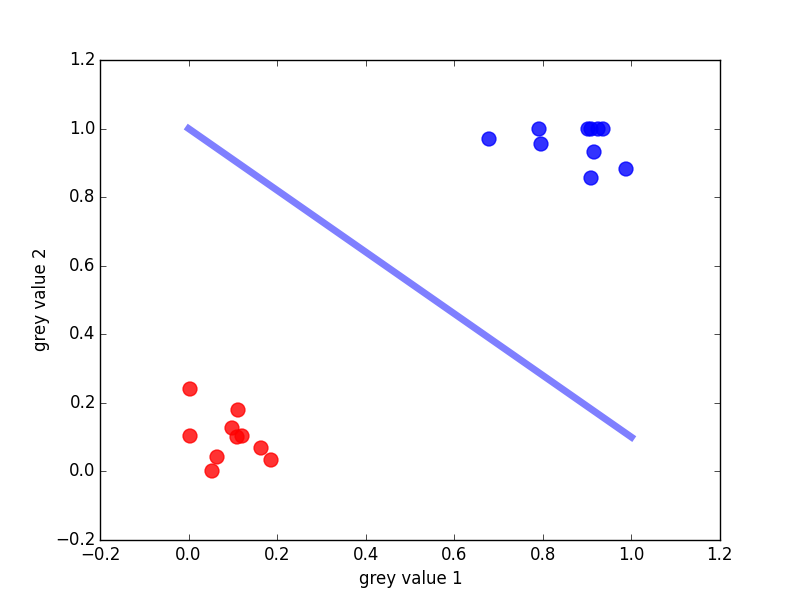
Interestingly, this looks very much like the stock price prediction above. The main difference is that we do not draw the line through the data but in such a way to separate the data. Still, in both applications we use a linear function.
Maybe it’s now a bit clearer how these linear functions translate into higher-dimensional spaces: the plane is a generalization of the line to 3D, and the hyperplane a generalization of the line/plane to higher dimensions! So in the future if we think about discriminating hyperplanes, we will usually visualize this as a line or a plane separating two sets of 2D or 3D points. And as before the mathematical field of linear algebra describes how to deal with these lines, planes and hyperplanes.
Summary
For now, you should have gotten a feeling for what functions do: translating input to output data. Functions can take different inputs and return different outputs, such as numbers and vectors. (In fact, they can even take other functions as inputs as well! But we won’t bother with these insane cases now.)
In the next post, we will get to the real meat: how to learn functions automatically.
TL;DR:
- Functions in the mathematical sense translate an input to an output
- The simplest and best understood functions are linear functions
- Functions map between numbers, or more general, vectors.
- Functions can map to single numbers, but also to vector
- If functions map onto a limited set of categories/classes, we call them classification functions
Footnotes:
- Of course this is largely oversimplified. The actual price would also depend on the size of the company at the time, economic health of the country, stock market crashes, etc. But for the sake of the example let’s assume none of these factors plays a role.
- To cite the mathematician Ian Stewart: “Classical mathematics concentrated on linear equations for a sound pragmatic reason: it could not solve anything else.”