The Curse of Overfitting
In the last post we obtained an understanding of how to learn functions from data, and we developed our first learning method. In this post, we will start building an understanding of why learning from data is actually pretty hard. The first problem we are facing is the curse of overfitting. Let’s see what that is.
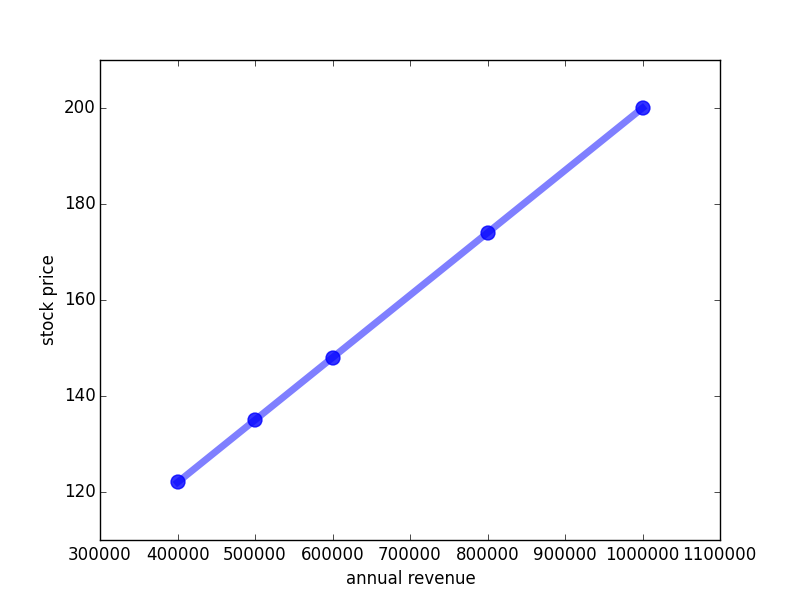
Recap again the stock price prediction problem: given the annual revenue of a company, we want to predict the company’s stock price. I have given you set of example data and we have found the following linear regularity in the data:
Alhough I told you that these linear functions are really cool and mathematics can cope with them quite well you have probably already thought of many cases where linear functions do not suffice and we need different ones. And indeed, even in the stock price problem, there seems to be no reason for disregarding different functions, for example this one (red curve):
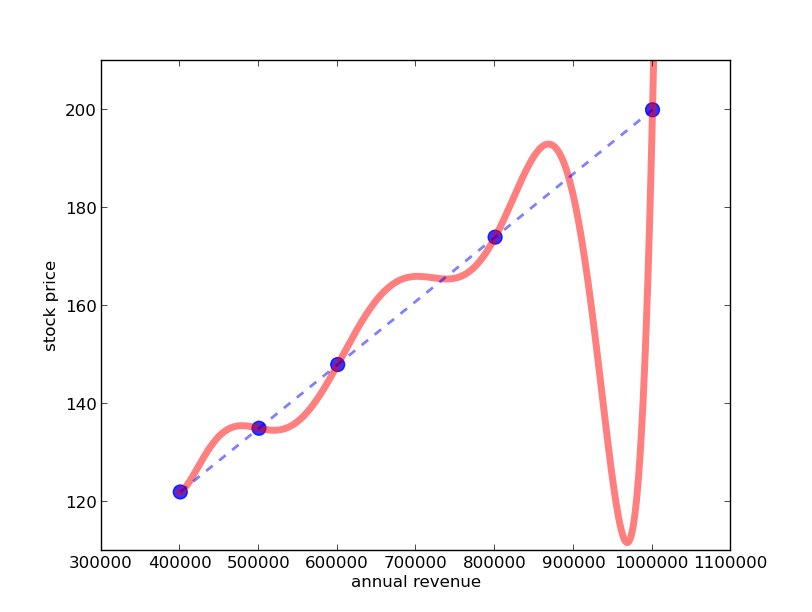
It is not as nice as the line, but it perfectly passes through all of the data points. And from an economic perspective this function looks much better as it predicts that if annual revenues exceed 1000000 Euro the stock price will go up much more quickly! So better go and buy some shares now!
Occam’s Razor
Let me give you a reason in defense of the linear function: the function’s simplicity. Although both functions perfectly fit the data (both the blue line and the red curve perfectly coincide with the blue dots) the line has much less wrinkles than the curve - namely zero rather than six! For the line we do not have to choose whether the wrinkles go up or down, how high/low they should go etc.
In fact, this type of reasoning is so common that it has already been brought up over 700 years ago by William of Ockham. Therefore, this principle is called Occam’s razor (although Ockham wasn’t the first to bring it up, nor was he known for being particularly passionate about shaving). It states that “among competing hypotheses that predict equally well, the one with the fewest assumptions should be selected”.
Overfitting
Although this explanation of Occam’s Razor sounds reasonable, there is an even better way of arguing why we should prefer the line in this stock price example. Occam’s razor rejects the wrinkled function because we have to make too many choices about the direction and the size of the wrinkles. In fact, there are infinitely many wrinkled functions going through all of the points, for instance this one (green line):
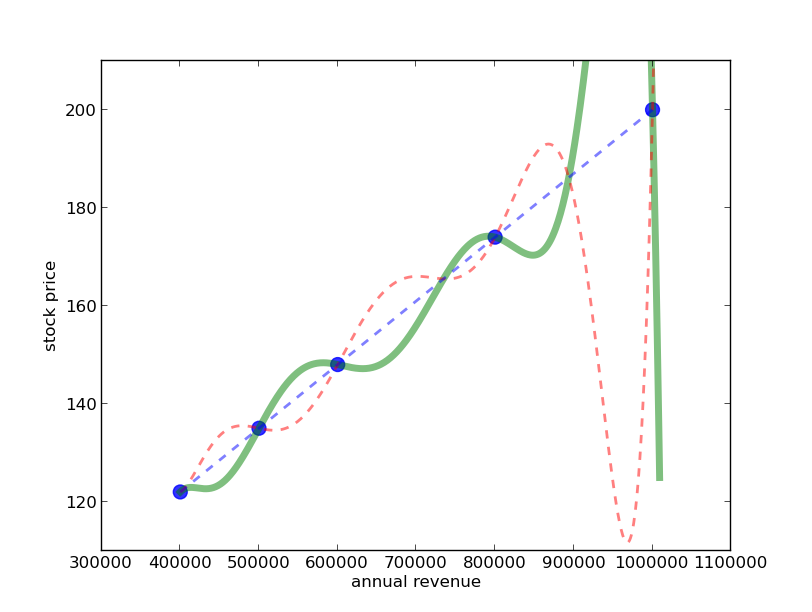
The problem with that is that the chance of picking the wrong wrinkled function is much higher than picking the wrong straight line - because (at least in our example) there is only one line that goes exactly through all of the points. I cannot rotate or shift the line up without it losing contact with one or more of the points. Therefore, we should prefer the line. So in a way, we have given a justification of Occam’s razor by realizing that using a more complex function for predictions forces us to take more arbitrary decisions, which makes us more prone to making mistakes.
Random fluctuations
In the case where the data lies exactly on a line the answer was clear that the line is the best choice. However, in reality, data is not perfect but almost always undergoes random fluctuations and noise. So let us make the stock prediction data a bit more realistic and then look at how well line and wrinkled function explain the data:
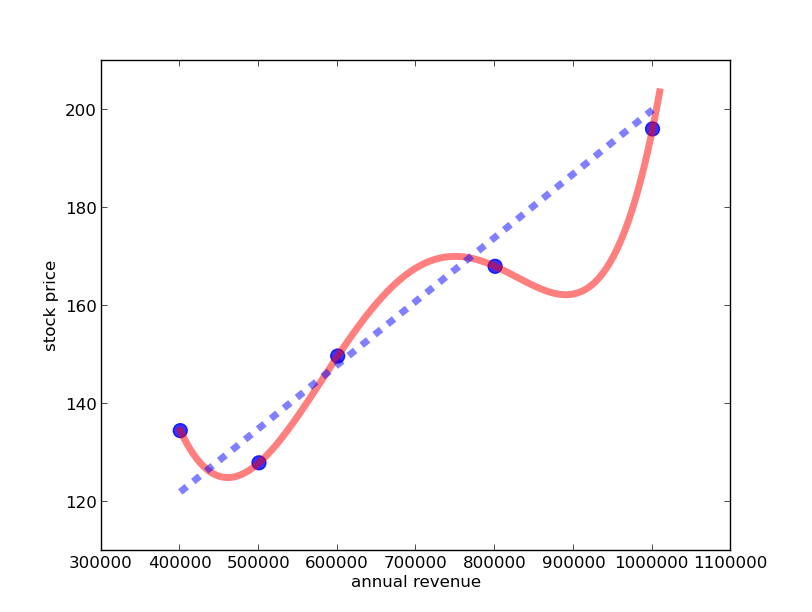
We see that no line will be able to pass directly through all the data points, but we have easily found a wrinkled function doing so. Still the line shown here seems to capture the main trend quite well. Which of the two functions do you prefer for making predictions about future stock prices?
Since I have told you that the fluctuations are random, you will probably prefer the line - even though it does not fit the data exactly. Although the wrinkled function explains the individual data points well, it does not explain the more moderate trend of the revenue-stock price relationship well; it focuses too much on explaining the random fluctations in the data. Data scientists call this general effect overfitting, and we say that the wrinkled function overfits the data.
Battling Overfitting
Out there in the real world, discovering whether your function overfits or not is really hard. Probably, it is the problem of machine learning. It is so prominent that two machine learning professors have even written a song about it. Seriously:
Luckily, there are a few things you can do to counteract overfitting apart from singing about it. I want to give you a few examples.
First, you can retain some preference for simpler explanations, by making a similar argument as before: even for the randomly fluctuating data there are still only a few lines that are not too far away from any of the points. But since there are infinitely many wrinkled functions passing directly through all of the points, the chance of picking the wrong wrinkled function is very high. So using a simpler function is better.
Secondly, you can hold back some of your data and not use it for finding the function - you only use it after having computed the function to test how your function copes with that unseen data. If your function really sucks at explaining the data you have held out (called test data) you should consider using a different type of functions. In fact, using test data is a standard procedure in machine learning and everyone has to do it because fitting well your training data does not tell you at all whether you learned the right thing.
Third, you can use more data. In fact, this is why everyone is so excited about big data which heavily relies on lots of data being available. It does work well, but we will see in the next post, that there are some limitations about how much data you can get.
Forth, you can get more knowledge about which shape of the functions you actually expect. If for example you know that the stock price varies in cycles, that is goes up, slightly down, then up again etc., you can try to find a function that reflects this knowledge.
Although all of these things are good ideas and they definitely help to counteract overfitting, in the end you still have to keep your fingers crossed and hope your function predicts the right thing. There is no guarantee that your function doesn’t overfit although all of the things suggested make it less likely.
I hope that by looking at this very simple example, and by understanding how overfitting can occur here, you have already come to think more critically about decision making - both in machines and in humans.
Underfitting
Last but not least, let me say that of course also the opposite thing can happen: underfitting. If we choose a function that is too simple to explain a relationship we will not get a good prediction, either. I leave it as an exercise for you to think about a good example of underfitting.
That’s basically it - you have now understood the biggest problem of learning from data. And in case you want to brag in front of your friends, here is some more terminology: the topic of this post, that a function learned from data always has to balance under- and overfitting is also called the bias-variance trade-off. Variance relates to how much all possible different wrinkled functions vary - the more wrinkles you allow, the higher is the variance of your learning method and hence the more prone the learner is to overfitting. Bias refers to underfitting, stating that a too simple function adds a systematic bias to the prediction which cannot be overcome by the learner, not even when given more data. The bias-variance trade-off is a smart way of stating that if don’t consider the simplest yet not too simple hypothesis, your hypothesized function is more likely to be wrong – too simple and wrong or too complicated and wrong.
This post elucidated the first big problem of machine learning: overfitting. Next, we will look at the curse of dimensionality.
TL;DR:
- Finding the right predictive function for data is hard
- Even if the function perfectly fits the data it might be totally wrong: an effect called overfitting
- Occam’s razor states that one should prefer simpler solutions
- A justification for this is: when using simpler functions we are less likely to pick the wrong one
- Underfitting occurs when choosing too simple functions
- Singing about data science is fun
Further Reading:
- Lecture notes by Luke Zettlemoyer from University of Washington on overfitting.
- Wikipedia article on Occam’s razor.
- Simple Java applet for playing around with data fitting. The switch “degree of polynomial” corresponds to the “wrinkles” in the function.