The Curse of Dimensionality
In the last post we have looked at one of the big problems of machine learning: when we want to learn functions from data, we have to fight overfitting. In this post we will look at another archenemy of learning: dimensionality.
Parameters
Let’s briefly recap our stock price prediction example. In an earlier post we used random search to find the parameters of a line that explains the training data examples well. The algorithm learned two numbers, namely the parameters p1 and p2:
where visually, p1 changes the slope of the line and p2 the shift along the y-axis of a line.
The random search learned the numbers p1=0.00015 and p2=58:
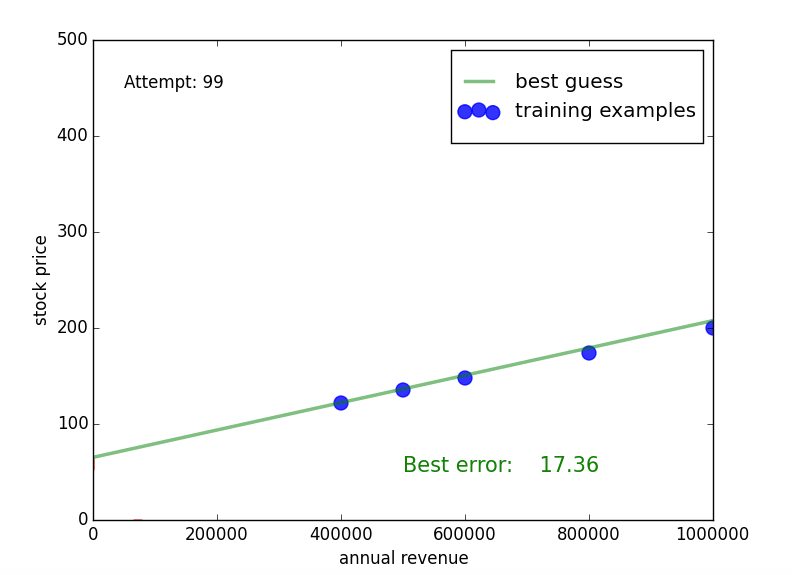
This line is not very far away from the parameters of the “true” function p1true=0.00013 and p2true=70. Interestingly, for the learned function the slope p1 is a bit higher, but this is “compensated” by a lower shift p2. Intuitively, this makes sense: the higher the slope, the more we need to shift the line downwards in order to approximately hit the training examples. We will see in a second why this observation is important.
Adding dimensions
Now, I would like to reason about the influence of the number of parameters of a function on the difficulty of learning that function. You can think about the parameters of the line, but in fact I will formulate it in a general way.
For the sake of the argument let’s assume that we do not consider all possible numbers as possible parameter values, but that we restrict ourselves a fixed list of numbers (in mathematics that’s called discretization), and we make this list finite. To make it really simple, we will only use the numbers from 1 to 10.
Assume that we have a function that has only one parameter (for example, only the slope of a line), we immediately see that there are 10 possible values that the parameter can take. We visualize each value of the parameter by a blue box:
| 1 | 2 | 3 | 4 | 5 | 6 | 7 | 8 | 9 | 10 |
What happens if we add a second parameter that can take 10 values? Well, you might think that results in 10 values for parameter one and another 10 for parameter two, which makes 20. But unfortunately that’s wrong: we need to consider all possible combinations of the parameter values! The reason is that the parameters are usually dependent as we have seen in the line example: when changing parameter one (here the slope), we can still improve how well the line fits the data by changing parameter two (shift). Let’s visualize all possible combinations:
| (1, 1) | (1, 2) | (1, 3) | (1, 4) | (1, 5) | (1, 6) | (1, 7) | (1, 8) | (1, 9) | (1, 10) |
| (2, 1) | (2, 2) | (2, 3) | (2, 4) | (2, 5) | (2, 6) | (2, 7) | (2, 8) | (2, 9) | (2, 10) |
| (3, 1) | (3, 2) | (3, 3) | (3, 4) | (3, 5) | (3, 6) | (3, 7) | (3, 8) | (3, 9) | (3, 10) |
| (4, 1) | (4, 2) | (4, 3) | (4, 4) | (4, 5) | (4, 6) | (4, 7) | (4, 8) | (4, 9) | (4, 10) |
| (5, 1) | (5, 2) | (5, 3) | (5, 4) | (5, 5) | (5, 6) | (5, 7) | (5, 8) | (5, 9) | (5, 10) |
| (6, 1) | (6, 2) | (6, 3) | (6, 4) | (6, 5) | (6, 6) | (6, 7) | (6, 8) | (6, 9) | (6, 10) |
| (7, 1) | (7, 2) | (7, 3) | (7, 4) | (7, 5) | (7, 6) | (7, 7) | (7, 8) | (7, 9) | (7, 10) |
| (8, 1) | (8, 2) | (8, 3) | (8, 4) | (8, 5) | (8, 6) | (8, 7) | (8, 8) | (8, 9) | (8, 10) |
| (9, 1) | (9, 2) | (9, 3) | (9, 4) | (9, 5) | (9, 6) | (9, 7) | (9, 8) | (9, 9) | (9, 10) |
| (10, 1) | (10, 2) | (10, 3) | (10, 4) | (10, 5) | (10, 6) | (10, 7) | (10, 8) | (10, 9) | (10, 10) |
We see that we have 10 times 10, i.e. 100 possible parameter pairs. What happens if we add a third parameter? We get a cube with 10 times 10 times 10 equals 1000 parameters! And with 10 parameters each taking 10 values, we get 10.000.000.000 which are 10 billion different combinations of parameter values!
You probably see the formula behind our reasoning: If we have n values a parameter can take, and m parameters, we end up with nm possible parameter value assignments. We say that the number of parameter values grows exponentially.
Now how big of a problem is it? Well, it is very big indeed, which is why this problem is called the curse of dimensionality. The problem is that data are usually high-dimensional, and that each parameter usually has significantly more than 10 possible values.
For example, the tiny pictures we played around with in an earlier post had 27x35, that is 945 pixels. If we were to learn a function that has a parameter for every pixel and again every parameter can only take 1 out of 10 values we would still end up with 10945 parameter values - this is a number consisting of a 1 with 945 trailing zeros, and it is several orders of magnitudes higher than the number of particles in the entire universe! We will never be able to try out even a tiny fraction of all possible parameter values.
So we see that the curse of dimensionality forces us to find smarter ways of finding the parameters of functions. We will save this for later articles.
Hughes effect
Irrespective of the way how smart we go about searching for parameters, high dimensionality has another very problematic (and somewhat unintuitive) implication, namely for classification. This problem is also known as the Hughes effect. I will only sketch the idea very briefly but you find a more elaborate explanation with nice illustrative figures in this blog article.
The problem is stated as follows: recall that in classification, we aim to find a function that discriminates between two or more categories of input data. We presented a way of doing so, namely by finding hyperplanes in space that separate the categories. So how much easier or simpler does it get to find a hyperplane if the dimensionality of the data is higher?
Here comes the problem: the more dimensions the data has, the easier it is to find a hyperplane separating categories in the training data; but at the same time, the harder it gets to also perform well on the unseen data (for example, test data). The reason is that because we have more dimensions that we can choose from to lay the hyperplane through, we are much more prone to overfitting. Thus, having higher-dimensional data has the same effect as allowing our function to have more “wrinkles”. And the less training data we have, the less sure we are that we have identified the dimensions that really matter for discriminating between the categories.
Summary
In this post, we got to know another nemesis of data: high dimensionality. When looking at learning from the perspective of searching for the right parameters, each additional dimensionality means that we must search an exponential number of more parameter values. And in classification, every additional dimension makes it harder to find the right hyperplane to discriminate between the categories.
But another curse is already on its way; and it has to do with (no) free lunch.
TL;DR:
- Curse of dimensionality refers to the dimensionality of the data and parameters to be learned
- Searching for the right parameter values becomes exponentially harder with every dimension
- Similarly, in classification every dimension makes us more prone to overfitting by choosing the wrong dimension as discriminatory
Further reading:
- Excellent blog article by Vincent Spruyt on the curse of dimensionality in classification, aka the Hughes effect.