Learning Functions from Data: A Primer
In the introductory articles we have learned that data is a bunch of numbers encoding some information, and that data can be multi-dimensional which makes them live in vector spaces. We have also looked at the core competence of machine intelligence: applying functions to data. In this and the following posts we will look at the most powerful tool of machine intelligence: learning functions from data.
The roadmap is as follows. In this article, we will understand why learning functions from data is in principle rather straightforward. Indeed, at the end of this article we will have a developed a very simple learning method.
The next few posts will then bring us back down to earth and explain some fundamental problems that learning from data has, and discuss solutions to these problems. This will endow you with a powerful intuition of how learning from data works and what its limitations are.
Learning Functions from Data
In order to understand how learning from data works, let’s use as our running example the stock price prediction problem introduced earlier: given the annual revenue of a company, we want to predict the company’s stock price. We have learned that such a prediction is represented by a function. We discussed two representations of functions; first, tabular functions:
| input: Annual Revenue in January (Euro) | output: Price (Euro) |
|---|---|
| 40.000 | 122 |
| 50.000 | 135 |
| 60.000 | 148 |
| 80.000 | 174 |
| 100.000 | 200 |
These functions had the drawback that we could not extrapolate from them, that is we do not know from this table what the stock price would be if, for example, the company’s revenue was 120.000 Euros per year.
Therefore, we were interested in finding a different function representation, and I suggested to use linear functions, namely this one:
I have told you that since the function is a linear we can visualize it with a line:
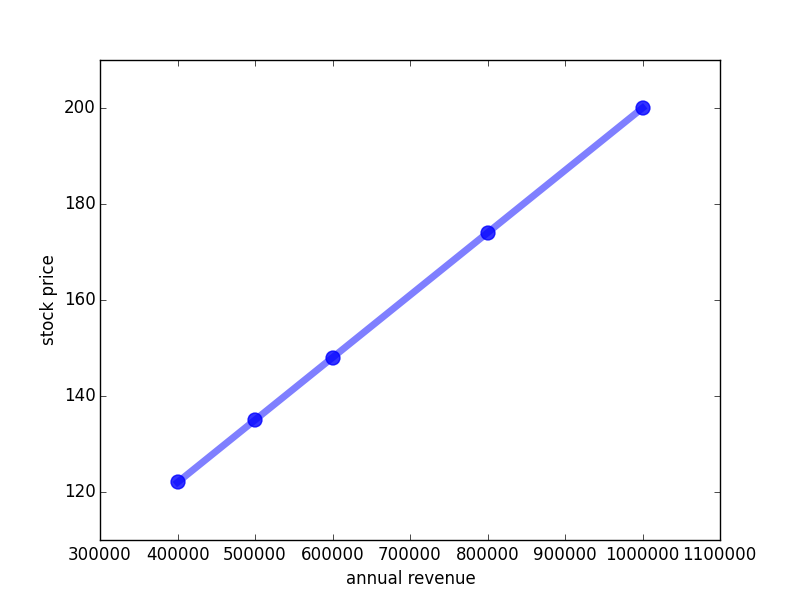
More importantly, the regularity enabled us to predict the stock price given any annual revenue. Intuitively, when the the revenue gets higher, the stock price moderately increases.
How to extrapolate from data?
By drawing the line through the bunch of dots, I actually did the task that the computer is supposed to do: I looked at the data, and I found out that there is a linear relationship between stock price and annual revenue. But what I really would like to do is to give the machine the data from the table above and let it figure out on its own how to make stock price predictions into the future! How do we do that?
Automating exactly this process is the core of machine learning. In machine learning, you are given a set of training examples - which correspond to the table given above (and are visualized by the blue dots). These training examples are a bunch of data that need to be in the form (input, output) where output is the true, known output for the given input. The computer should then spit out an appropriate function, namely the blue line. Luckily, the stock price training data are exactly in the form (input, output). So how to learn from them?
I will now show you the simplest learning procedure I could come with. And it is indeed very simple! Intuitively, the computer will do the following: we tell the compute to use some line which should relate input and output, and the computer will then fiddle around with this line until it comes as close as possible to as many training examples as possible. That’s it!
Problem solved?
Defining the learning problem
Well, almost. If we would ask our computer to do that, it would reply with some of the following questions:
- What function should I find? How is it represented?
- What does “as close as possible to as many training examples as possible” mean?
- What does “fiddle around” mean?
So let’s give our eager computer some answers:
- Start off with a single line. A line is represented by two basic parameters: how much it is shifted up or down (the 70 in the example above), and its slope (the 0.00013).
- Calculate the difference of every training example to the value predicted by the function the computer guesses. When we sum all of these differences up we obtain a single number which we call the training error. The training error allows us to calculate how well any line fits the training examples.
- Do random guessing; we randomly guess a line (more precisely, its parameters) and see how well it fulfils the criterion defined in 2.
That sounds like a plan, doesn’t it?
Let’s first get an intuition what the training error looks like for some randomly guessed function:
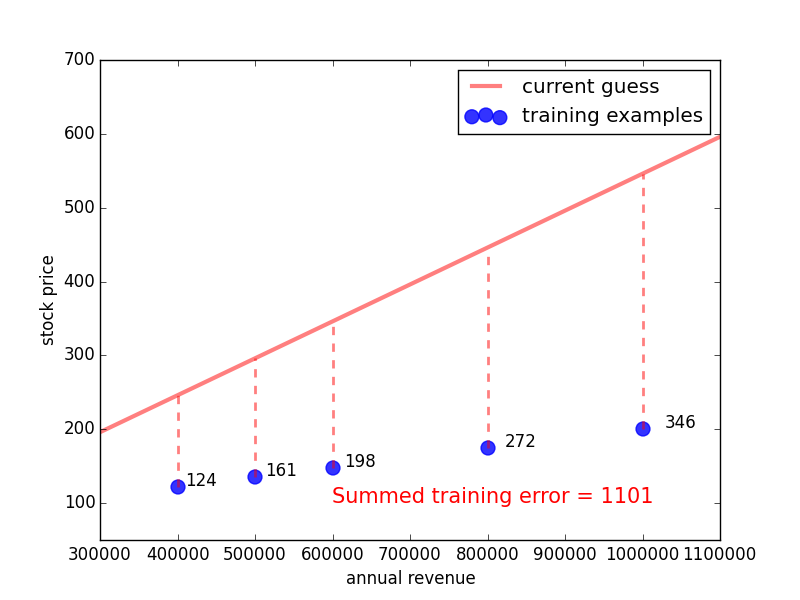
Here, the blue dots are the training examples, the red curve is the random guess, the dotted lines indicate the discrepancy between the guessed line and the training data, and the numbers next to the lines indicate how big the discrepancy is. By summing over all these differences, we obtain the red number at the bottom. This number is the training error - we want to get it as low as possible in order to find a highly predictive function.
So how does random guessing perform? The following video shows what this looks like for 100 random guesses. The green line is the one with the lowest training error so far. We see that it takes some guesses, but eventually we get a close match of the green line and the blue dots, the guess and the training data.
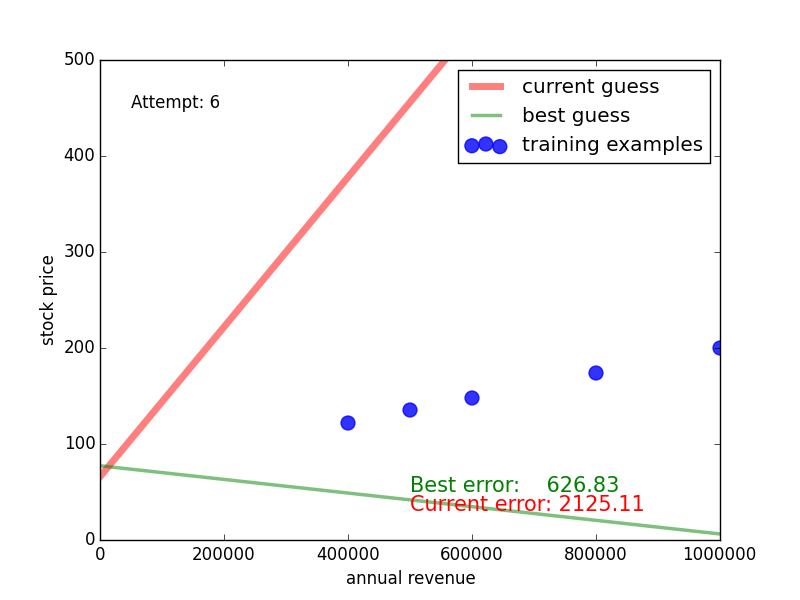
Congratulations: you have witnessed your first machine learning algorithm [1]!
Caveats
You might be a bit disappointed now. Random guessing? That’s machine intelligence? That doesn’t seem intelligent at all! Fair enough, that is the simplest thing you can do. And in practise, it won’t work very well. Yet, some of the most powerful algorithms do apply random guessing (which is officially called random search) but combine it with some “tricks” to make the guessing smarter. So random search is an important building block for creating learning algorithms, although it’s not very powerful when used on its own.
At this point, we can already think about why random search does not work so well on its own. Here are a couple of thoughts.
First of all, you don’t now how big you should go. Should you shift the line only between -1 to +1, or from -1000 to +1000? Should you try out both 1.1 and 1.10001? That means, in which granularity should you vary the parameters? In fact, in the animation above, I have set the bounds of the parameters very tightly around the real (but in the usual case unknown) parameters. Otherwise, the search would have taken much longer.
Second, we don’t learn from our mistakes. If I have guessed line 1 that got a training error of 1000. Next, I guessed line 2 with a training error of 800. Intuitively, I should try to find out what might line 2 better than line 1, and progress into that direction. Instead, random search will just look for a new line which might be much worse than both line 1 and line 2.
Can you think of more issues? [2]
Terminology
Before we close, a note on terminology. Some paragraphs ago, we had to specify three things for our learning algorithm to work. I want to quickly state how these things are called in machine intelligence.
- Model, function representation (sometimes also hypothesis space): What kind of functions do I look for?
(In the example: single straight lines) - Objective or loss function [3]: Criterion for evaluating whether the learned function is good. Often this is the training error, a measure of how well the learned function accounts for the training data.
(In the example: distance between samples and function) - Learning algorithm: In which way to come up with functions (or parameters) in order to get a good value for the loss function.
(In the example: random search)
Moreover, if you learn from training data of the form (input, output), the approach is called supervised learning. The picture is that the pupil comes up with different inputs, and a supervisor gives the pupil a hint by telling her the right output, and the pupil tries to figure out the regularity (aka function) from these hints.
Finally, there are two general types of supervised learning, which depend on the type of function you want to learn. If you learn to map an input to a continuous number (as done in the stock price example), the learning task is called a regression task; in the last post we called this fitting a line through the data. In contrast, if you map the input to a category (as in the image classification example), it is called a classification task. We solve this class by finding a (hyper)plane or line that separates the data.
In the next post, we will critically assess what we have done, and find out that there is a fundamental issue in learning from data which we have neglected so far. It is coarsely related to the question: why did we actually use a straight line, and not something with the shape of a curve or a snake?
TL;DR:
- Machine intelligence learns functions from data
- Data are given as training examples, that is input-output pairs
- This type of learning is called supervised learning
- To allow a compute to learn, we have to define model, objective and a learning algorithm
- Random guessing is a learning algorithm that works for very simple problems
Footnotes:
- An algorithm is the machine intelligence people name for “recipe”. It is a list of steps that you have to execute in a certain order; it has to be detailed enough so that the machine has no doubt about what it has to do.
- Think, for example, what happens if your function has more parameters, let’s say twice as many. How much harder does the learning problem then get?
- Note the term loss function. The criterion itself is again formulated as a function - but this is not the function want to learn! It is an auxiliary function that takes as input three arguments: a set of (1) inputs and (2) outputs of all the training data and (3) the corresponding outputs of the learned function. It outputs a single number, assessing the quality of the learned function for the training data. In contrast, the learned function takes only one input, namely the one it requires to predict the output.